This is a basic notebook example
First we create a numpy random matrix
import numpy as np

matrix = np.random.rand(10,10)
matrix
array([[0.2974975 , 0.0650699 , 0.49563615, 0.73863867, 0.83073418,
0.50264861, 0.08965232, 0.47833115, 0.64822776, 0.351124 ],
[0.46149068, 0.65161462, 0.42058146, 0.6591987 , 0.99182271,
0.99721184, 0.78005607, 0.05684765, 0.69957011, 0.68944096],
[0.51015054, 0.83750948, 0.05286185, 0.53514124, 0.49172694,
0.0882386 , 0.79367203, 0.56370555, 0.294414 , 0.73442567],
[0.5919751 , 0.108088 , 0.96126498, 0.34382224, 0.66661092,
0.59605311, 0.12496092, 0.5327605 , 0.38754497, 0.87451131],
[0.02231628, 0.54081173, 0.16539671, 0.82296151, 0.9165375 ,
0.80313685, 0.63668444, 0.64005767, 0.96783502, 0.82131932],
[0.59390943, 0.49358977, 0.49894508, 0.94743515, 0.49835286,
0.77626678, 0.98873043, 0.09891824, 0.49600738, 0.70308903],
[0.24394859, 0.72335612, 0.6276923 , 0.01886765, 0.3615142 ,
0.58836859, 0.61295262, 0.9005715 , 0.55090559, 0.03693275],
[0.6865032 , 0.82106194, 0.530781 , 0.86942365, 0.60800709,
0.62321886, 0.08104068, 0.29363257, 0.53117713, 0.88545632],
[0.53677123, 0.04466456, 0.42995833, 0.36398545, 0.48013742,
0.44160403, 0.37993597, 0.05632432, 0.3061751 , 0.53883281],
[0.22678259, 0.57697914, 0.07638444, 0.03669613, 0.35155712,
0.74935156, 0.7460768 , 0.24062255, 0.85282691, 0.77600708]])Convert it into a pandas dataframe
import pandas as pd

df_matrix = pd.DataFrame(matrix)
df_matrix
Loading...
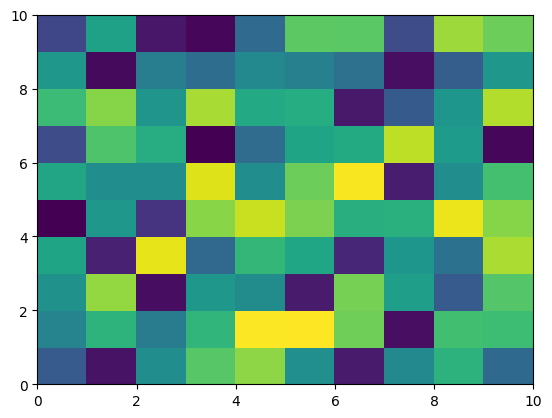
Plot a heatmap
%matplotlib inline
import matplotlib.pyplot as plt

plt.pcolor(df_matrix)
plt.show()